Dashboards
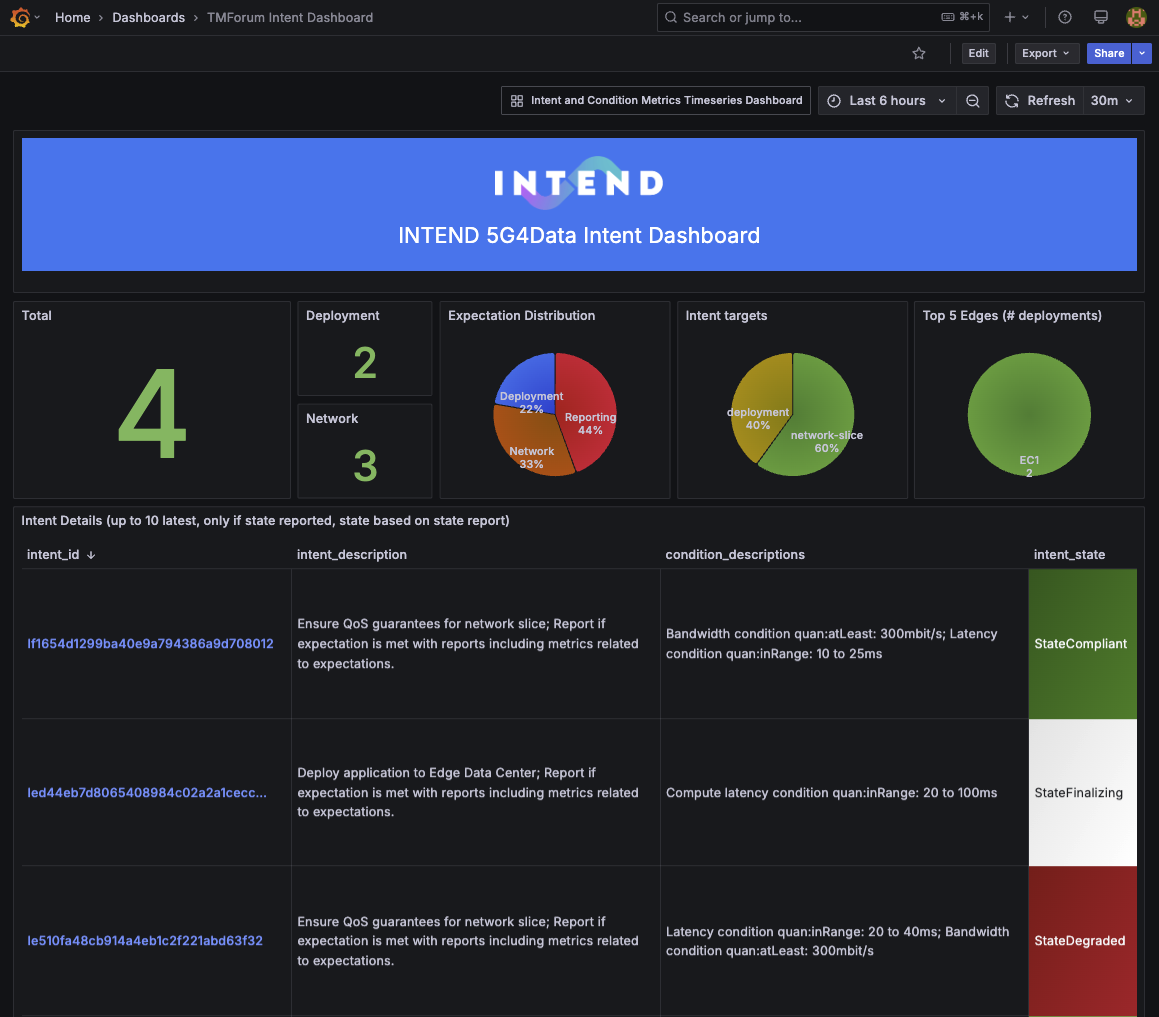
Since both the intent simulator stores intents and intent reports in a knowledge graph we can use the knowledge graph to create dashboards that can be used to visualize the intents and intent reports. The dashboards are created using Grafana and the knowledge graph is queried using the Sparql data source plugin for Grafana. The dashboards are created to visualize the intents and intent reports in a user friendly way. The code for the dashboards is available here. This figure shows a Grafana dashboards that gives an overview of intents and some aspects about the intents:
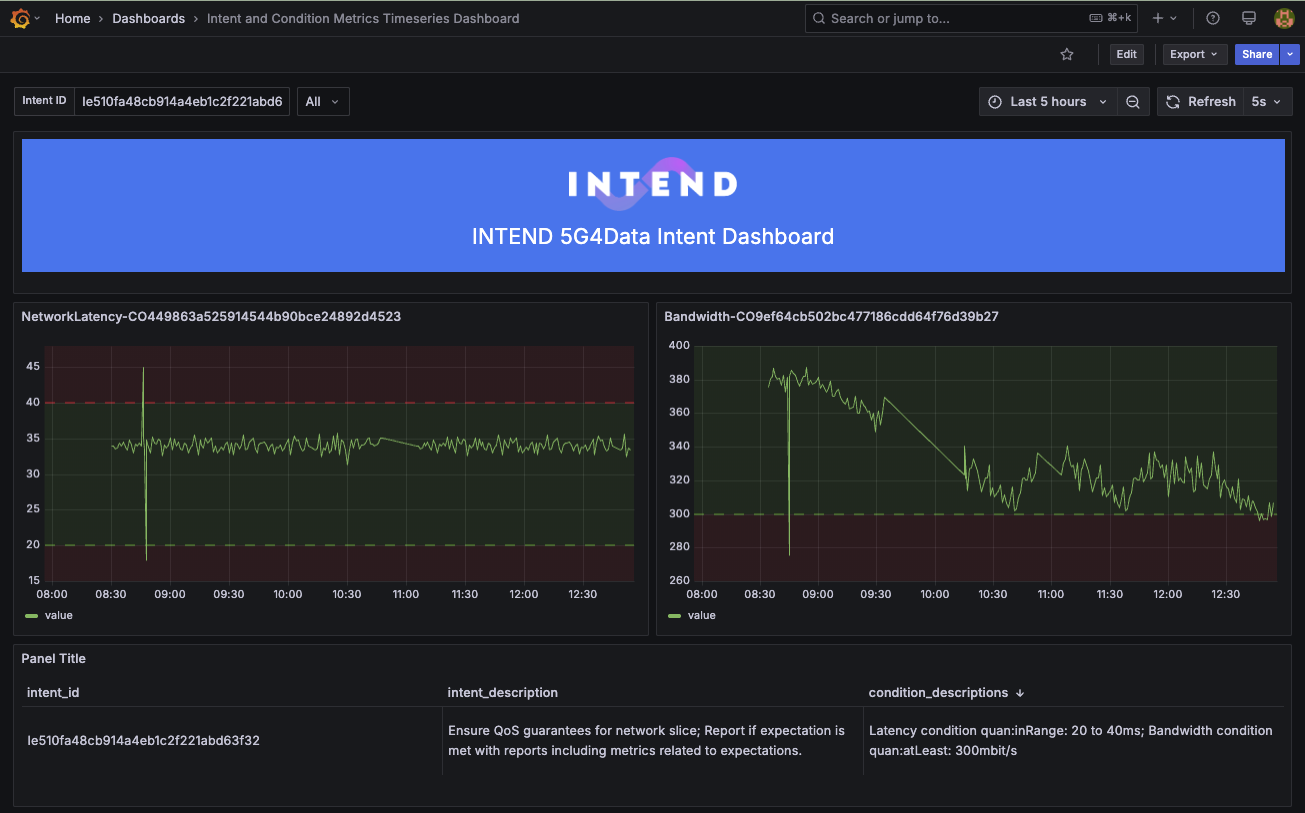
This figure shows a dashboard that was created to visualize detailed observations related to one intents conditions: